Chrome, ERR_SPDY_PROTOCOL_ERROR or ERR_HTTP2_PROTOCOL_ERROR, and an invalid HTTP header
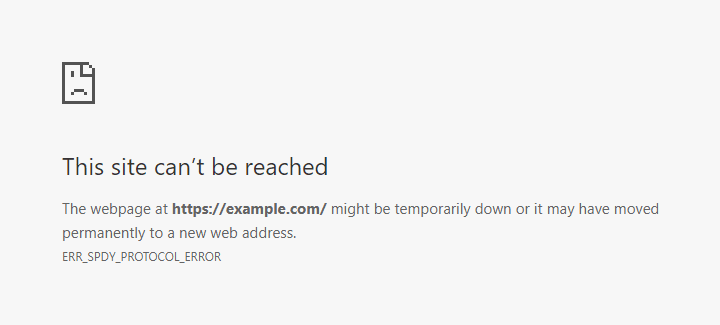
When migrating your site to a more performant HTTP/2 protocol, it may happen that Chrome will not load a page and will instead display This site can’t be reached with ERR_SPDY_PROTOCOL_ERROR, or ERR_HTTP2_PROTOCOL_ERROR in newer versions. HTTP/2 is derived from the earlier SPDY protocol, that's probably why the error message mentioned SPDY in the older browser versions. I'll show you how to figure it out with chrome://net-export.
One of the reasons why you may see the ERR_SPDY_PROTOCOL_ERROR or the ERR_HTTP2_PROTOCOL_ERROR message is an invalid HTTP header coming from the server. Chrome is a bit more strict when processing binary HTTP/2, can't handle a header with a space instead of a dash (e.g. Referrer Policy instead of Referrer-Policy), so check your headers are being sent correctly. Firefox ignores such invalid HTTP header and will just display the page.
If you're using nginx as a web server, you may also see a message like this in the error log:
upstream sent invalid header: "Referrer\x20..." while reading response header from upstream
Here's how to find the offending header in the browser.
Chrome 71 and newer
Released in December 2018, Chrome 71 has removed chrome://net-internals/#events but luckily there's another way. A bit longer but just a few more clicks.
Go to chrome://net-export/ (copy and paste the link), click the Start Logging to Disk button, select where you want to store the network log file. Try loading your misbehaving site in another tab, then go back to chrome://net-export/, hit Stop Logging. The network log file contains events encoded as JSON so you'll need a viewer.
You can get a standalone web app or just use NetLog viewer available online. The online viewer processes the data locally in your browser, it does not upload your log files to Google or anyone else. So let's use it. Upload the JSON log file generated by the browser, and after a second or two you should see Data Loaded, creation date, Chrome version and some more info.
Select Events in the left menu, type your domain into the search box and click the row with HTTP2_SESSION in the Source Type column. 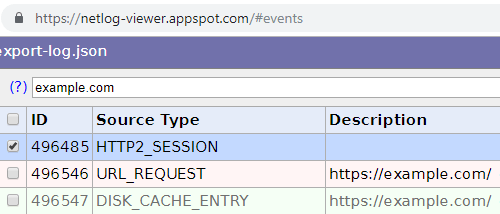
You can now skip to the Reading the log part.
Chrome 70 or older
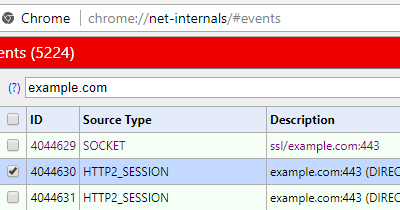
Go to chrome://net-internals/#events (the link is not clickable, but you can just copy and paste it), type your domain into the search box there (I'll use example.com as, well, an example), then try loading your misbehaving site in a different tab. Go back to chrome://net-internals/#events and click the row with HTTP2_SESSION in the Source Type column.
The process described above for Chrome 71 works in older versions too. Using chrome://net-internals/#events was just a bit faster though.
Reading the log
Once you've loaded the events and selected the HTTP2_SESSION event type, you'll see an HTTP/2 protocol details on the right side, this is the important part:
t=155893 [st=3251]  HTTP2_SESSION_RECV_INVALID_HEADER
                    --> error = "Invalid character in header name."
                    --> header_name = "referrer%20policy"
                    --> header_value = "no-referrer,%20strict-origin-when-cross-origin"
t=155893 [st=3251]  HTTP2_SESSION_SEND_RST_STREAM
                    --> description = "Could not parse Spdy Control Frame Header."
                    --> error_code = "1 (PROTOCOL_ERROR)"
                    --> stream_id = 5
See the line with HTTP2_SESSION_RECV_INVALID_HEADER? There's an error description and an invalid header just below it, in this case it's the referrer policy header, with space (URL-encoded as %20) instead of dash. Header names in HTTP/2 must be converted to lowercase, so even if you send Referrer-Policy from your app, the browser sees referrer-policy. Or invalid referrer policy in this case.
You'll find a lot of interesting things about your browser internals in chrome://net-internals/ or in logs exported from chrome://net-export/ in newer versions. There are requests which are not even displayed in Developer Tools, like the ones coming from extensions. Go and check it out, might be handy next time you need to debug something. I've used it when researching Opera browser “VPN” or unencrypted “VPN” in UR browser.
chrome://net-export/ is also useful for figuring out CORS preflight requests. Since version 79, Chrome has moved them out of the renderer process, so you won't see the OPTIONS requests in Developer Tools anymore (hopefully they're coming back soon).
You can use Fiddler with NetLog Importer to read chrome://net-export/ logs, see how-to.

Michal Špaček
I build web applications and I'm into web application security. I like to speak about secure development. My mission is to teach web developers how to build secure and fast web applications and why.